Introductory Theory and Terminology
NMR is a technique used to analyze the structure of many chemical molecules, primarily organic compounds. A typical compound might consist of carbon, hydrogen and oxygen atoms.
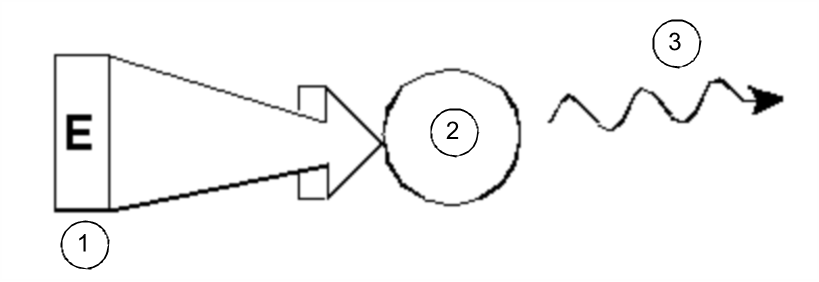
In its simplest form, an NMR experiment consists of three steps:
- 1.
- Place the sample in a static magnetic field.
- 2.
- Excite nuclei in the sample with a radio frequency pulse.
- 3.
- Measure the frequency of the signals emitted by the sample.
Excitation and Response
From the emitted frequencies analysts can deduce information about the bonding and arrangement of the atoms in the sample. The NMR active nuclei in the sample resonate at different frequencies which are called "resonance frequencies“. These are the frequencies emitted by the nuclei when they are excited by the incoming radio frequency pulse. The value of a resonance frequency depends on two factors:
1) Type of Nucleus:
Every isotope has a particular combination of protons and neutrons in its nucleus. The nuclear structure largely determines the value of the resonance frequency. Thus every isotope displays a “basic resonance frequency”. 13C nuclei will have a different basic resonance frequency compared to that of 1H etc. Note the large variation in basic resonance frequencies between different isotopes as listed in the following table:
Table of Data for Various Isotopes (frequencies quoted for an 11.7T magnet)
2) Local Atomic Environment:
Superimposed on the basic resonance frequency is an effect due to the local atomic environment in which an isotope is situated. The precise value of the resonance frequency of a 1H nucleus in a particular compound will depend upon the atoms it is bonded to and surrounded by. The nucleus is surrounded by electrons which may be viewed as moving electrical charges with associated magnetic fields. These electrons act as a source of magnetic shielding for the nucleus. The extent of the shielding will depend on the precise local atomic environment. The size of typical local field variations (which will result in a frequency variation) will depend on the isotope and the strength of the magnetic field in which the sample is placed. The table below shows the typical frequency variation for two of the most widely used NMR nuclei, 1H and 13C. It is clear that the local atomic environment has a relatively small effect on the basic resonance frequency.
Frequency Variations (quoted for an 11.7 T magnet)
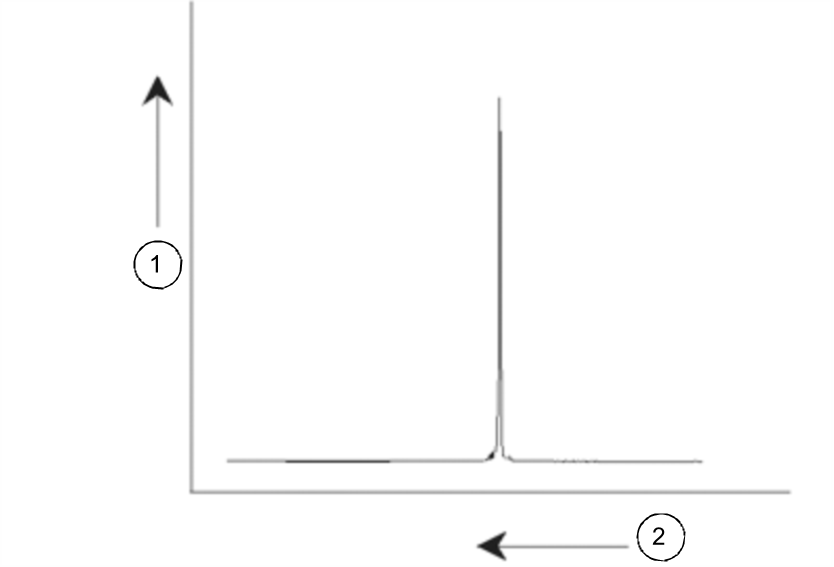
NMR signals are usually plotted as spectra and analyzed with respect to two features, frequency and intensity. It is conventional in NMR to plot frequency on the horizontal axis and increasing towards the left.
NMR Spectrum
As mentioned above, the frequency yields qualitative information regarding the local atomic environment. The integrated intensity of a signal is a measure of signal strength and is determined by integrating the area under the signal peak. The integral will be directly proportional to the number of nuclei contributing to a signal at a particular frequency (if all nuclei are equally excited) and hence will provide quantitative information regarding chemical structure.
To excite a given nucleus in an NMR experiment, the frequency of the excitation pulse should closely match the resonance frequency of the nucleus. This frequency is referred to as the carrier frequency. Thus, if experiments are carried out using a 11.7 T magnet, the 1H nuclei would require a carrier frequency of approximately 500 MHz, whereas 13C nuclei would require a carrier frequency close to 126 MHz. The carrier frequency is specified by the parameter SFO1. The nucleus that is excited by this carrier frequency is referred to as the observe nucleus.
Note that there are experiments in which more than one nucleus gets excited, e.g. during polarization transfer or decoupling. In these cases one has more than one carrier frequency but still only one observe frequency.
Not all isotopes will respond to radio frequency pulses, i.e. not all are NMR active. Three isotopes of the element hydrogen are found in nature: 1H (hydrogen), 2H (deuterium), and 3H (tritium, radioactive!). The natural abundance of these isotopes are 99.98%, 0.015%, and 0.005% respectively. All three are NMR active, although as can be seen in table 3.1, they all display a large variation in resonance frequency. To analyze a sample for hydrogen, the 1H isotope is excited, as this isotope is by far the most abundant. Of the carbon isotopes found in nature, only one is NMR active. By far the most common isotope, 12C (98.89% natural abundance) is inactive. Hence, NMR analysis of organic compounds for carbon rely on the signals emitted by the 13C isotope, which has a natural abundance of only 1.11%. Obviously, NMR analysis for carbon is more difficult than that of, for example, 1H (there are other factors which affect sensitivity, these will be discussed in the next sections of this chapter).
Using the brief introduction to NMR outlined above, it is a good exercise to consider how the technique could be used to analyze the composition of chloroform (CHCl3).
Further information


