Reference Compounds, Hertz, ppm
It has already been stated that NMR signals are analyzed with respect to two characteristics, intensity and frequency. Absolute frequencies are measured in Hertz (Hz - cycles per second) or Megahertz (MHz). Reporting on measured signals is simplified if all frequency measurements are made with respect to a reference. For 1H NMR the recommended reference is a chemical called tetramethylsilane (TMS). When a 1H or a 13C spectrum is acquired the presence of TMS gives rise to a single, easily identifiable peak. This peak is referenced to zero and the frequencies of all other peaks are given in terms of their frequency relative to the TMS frequency. Thus, we can talk of a signal being 2.5 kHz "above“ the TMS peak. This is preferable to quoting the absolute frequency of the signal which might look like 500.1325 MHz.
Referencing signals to the TMS peak clearly cuts down the number of digits needed to describe the frequency of a signal. However, this can be even more simplified if the ppm unit is used instead of Hertz. The ppm unit represents frequencies as a fraction of the absolute resonance frequency which will depend on the strength of the magnet. The advantage of the ppm unit is that frequency measurements are independent of magnet strength. This greatly simplifies the comparison of spectra acquired on different spectrometers.
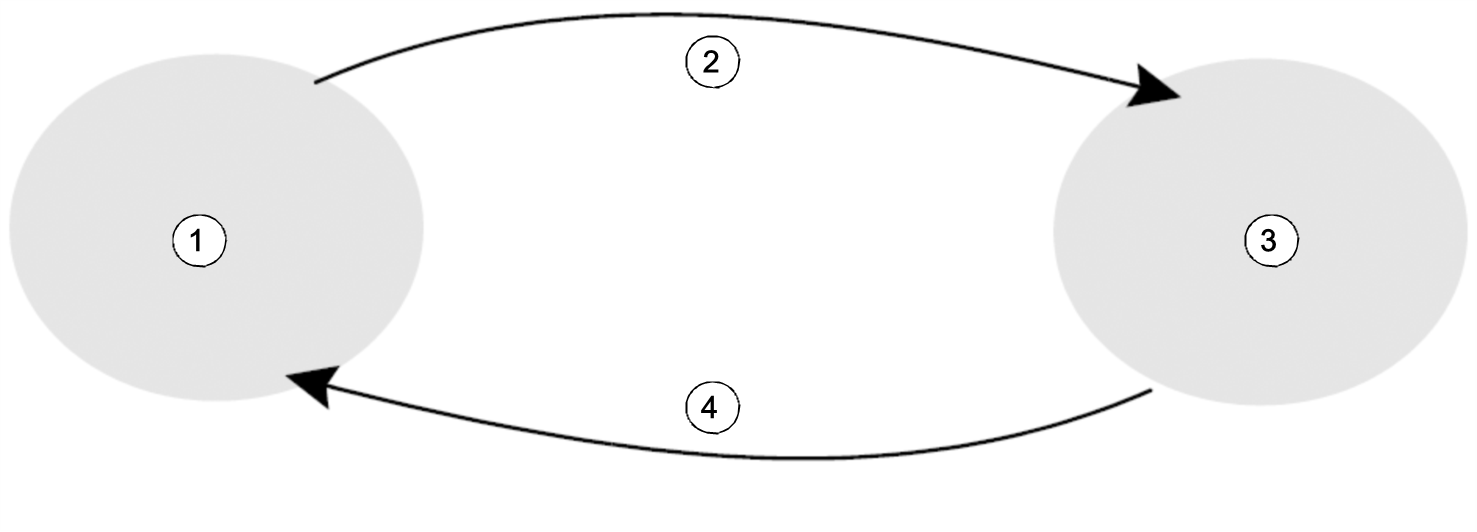
The conversion factors to be used when changing from Hertz to ppm and vice versa are shown in the diagram below.
Converting Hertz and ppm
The advantages of using the ppm unit are best illustrated with a practical example.
Suppose a 1H signal was observed at 2.5 kHz above TMS using a carrier frequency (SF01) of 500 MHz The frequency of any emitted NMR signal is directly proportional to the strength of the magnet. The same signal would appear at 3.0 kHz above TMS on a 600 MHz spectrometer and at 2.0 kHz above TMS on a 400 MHz machine. A single conversion may not be a great inconvenience but it must be done for every peak for each system. Now consider the same signal but quoted in the ppm unit.
Frequency in Hertz divided by SFO1 = Frequency in ppm
Examples:
2500 Hz / 500 MHz = 5 ppm
3000 Hz / 600 MHz = 5 ppm
2000 Hz / 400 MHz = 5 ppm
The 1H signal may now be described as being located at 5 ppm "above“, i.e. "downfield“, the TMS peak regardless of the spectrometer frequency.
Experienced users will always deal in ppm, and spectra reproduced in scientific journals will have the horizontal scale graduated in ppm and not in Hertz.
The reader should be aware of some simplifications that have been made in the above example. The value of the 1H carrier frequency on a 500 MHz spectrometer will not be exactly 500 MHz. The carrier frequency to be used in a ppm calculation should be the precise value assigned to the parameter SF01. Similarly for the 600 MHz and 400 MHz spectrometers, quoted above the 1H carrier frequency, will not be exactly 600 MHz and 400 MHz, respectively.
Note also that a positive ppm value denotes a frequency higher TMS and is defined as "downfield“ relative to TMS.


