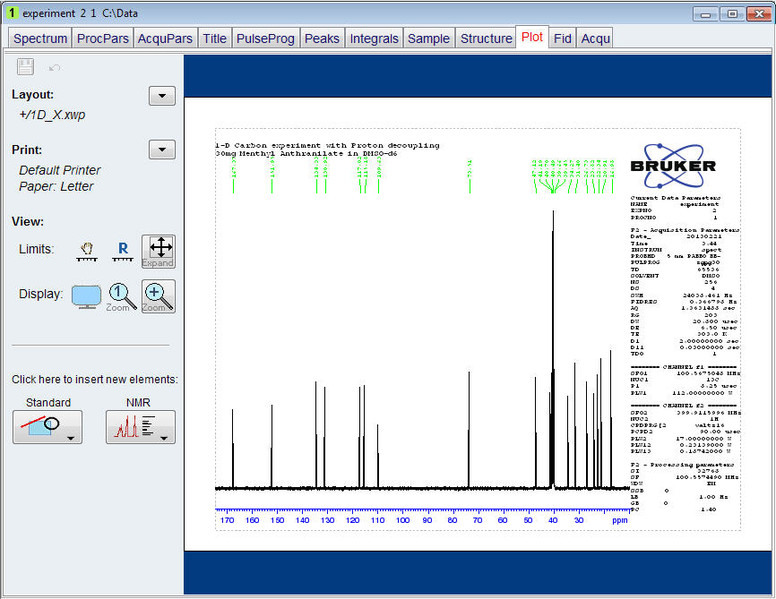
Plotting the 13C Spectrum
1. Expand the spectrum to include all peaks.
2. Click on the Retain expansion and scale icon in the Tool bar.
3. Click on the Publish tab in the Workflow tab bar.
4. Select the Plot Layout button in the Workflow button bar by clicking on it.
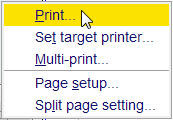
5. Click on the down arrow in the Print section of the Plot Layout window.
6. Select Print by clicking on it.


