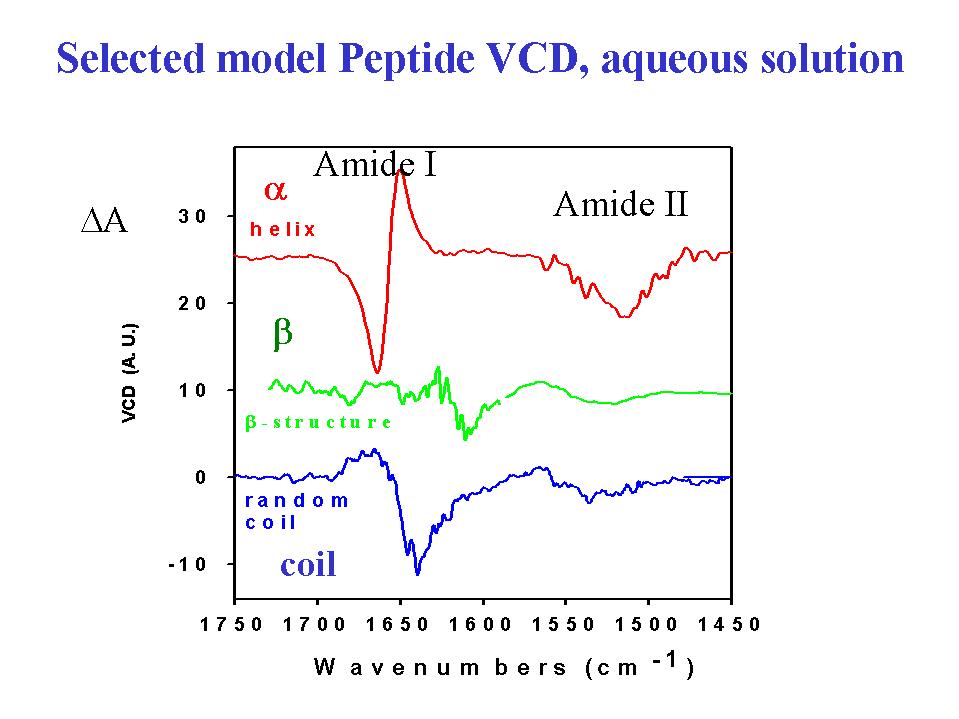
- Electronic circular dichroism in the ultraviolet9 (ECD) has become an indispensable tool for qualitative characterization of proteins in solution. However accessible amide transitions are limited in number, are broad and overlapping, and the resulting UV spectral bands are often sensitive to environmental or local perturbations. Vibrational spectroscopies, such as infrared (IR) and Raman, also have an established role for characterization of secondary structures of proteins and peptides. While exhibiting many resolved transitions, these are generally limited to measurement of relatively small frequency shifts characteristic of the effects of conformation on bond strengths or to perturbations due to hydrogen bonding. Vibrational CD (VCD) [and Raman optical activity, not developed yet for proteins in our lab, see Laurence Barron, Glasgow Univ.] has developed as a hybrid of these techniques and found application in the biomolecular structural studies (1). VCD can be used to correlate data for several different spectrally resolved transitions that involve different localized vibrations of the molecule; and each of these features will have a distinct band shape dependence on molecular stereochemistry.
- Empirical correlation of spectral features with secondary structure has historically been the most profitable route for stereochemical utilization of both electronic CD and vibrational(IR and Raman) spectroscopies. The difference in the origins of CD measured in the two spectral regions suggests that they would bear a complementary relationship that could enhance the quality and quantity of structural information derivable from eit her one alone and compensate for shortcomings of each. A series of studies on peptides of varying sequence and length have borne this out. VCD has a distinctively shorter length dependence that does ECD which leads to its having more sensitivity to the variety of secondary structure types seen in proteins (1). Quantitative approaches to a uniform systematic analysis of VCD, FTIR and ECD data, with the eventual goal of carrying out a coupled analysis, is a major topic of our ongoing studies.
- Experimentally, VCD spectra are routinely measured on either dispersive or FTIR-based instruments, both of which have been described in detail in the literature (2). To date, protein dispersive VCD obtained at ~10 cm-1 resolution by averaging several repetitive scans over the band of interest have a signal-to-noise ratio (S/N) advantage over FTIR-VCD spectra (3). Our spectra are usually obtained on very concentrated (up to50 mg/ml in D2O and 200 mg/ml in H2O) solutions in short path length (25 µ m and down to 6 µm for H2O) sample cells with CaF2 windows (4). In non-aqueous environments, for model peptides or solvent perturbation tests of protein structure, lower concentrations and longer path lengths are possible. For purposes of comparison and further spectral analyses, higher resolution and better S/N FTIR absorption spectra are obtained on the same or more dilute samples, and ECD spectra (180 nm) are obtained with much more dilute samples. All spectra are systematically treated using the SpectraCalc package of programs for data manipulation.
-
|