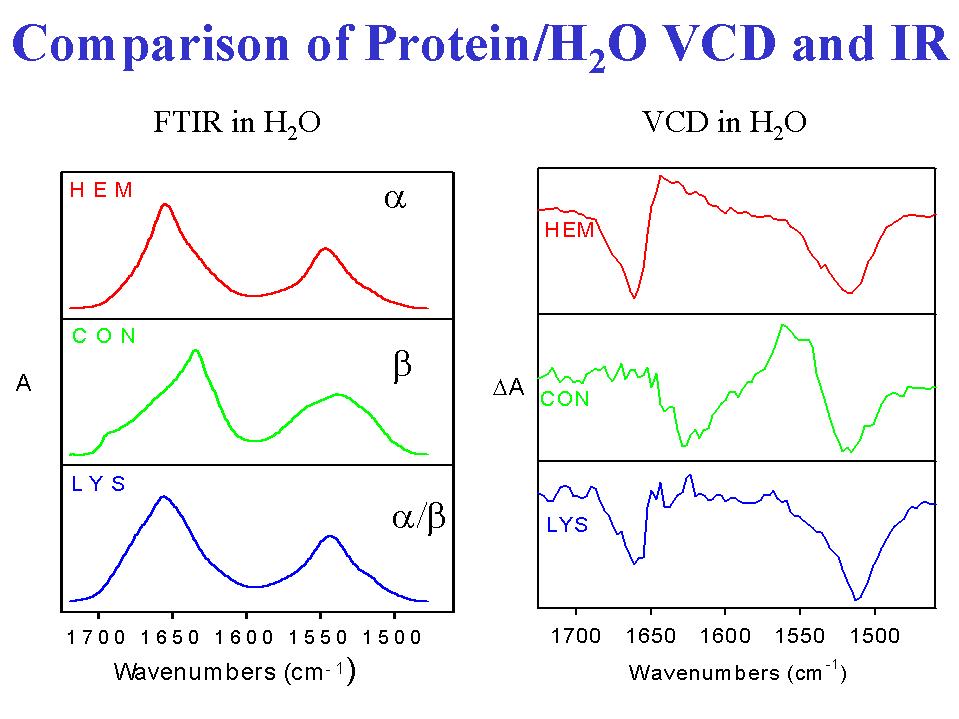
- In extending the application of VCD to proteins, we have obtained reproducible VCD spectra and profitably compared it to ECD andFTIR data for a range of proteins (1,3,4,9,12). As compared to IR spectra, the sign variation inherent in VCD gives it an effective resolution advantage in differentiating between proteins. Furthermore, the short range effects lead to different types of secondary structure contributing on a comparable basis to VCD, leading to more variation in band shape than in ECD, which is singularly dominated by the alpha-helical contribution. Our first experiments were focussed on the amide I' band, C=O stretch in D2O solution, due to its ease of detection and the relatively simpler sample preparations (more dilute, longer path). For example, hemoglobin is in the class of proteins whose secondary structure is dominated by the alpha-helix, while concanavalin A is dominated by its beta-sheetcomponents. Each of these has similarly shaped ECD with the main difference being intensity (1,3). In VCD, they have different amide I' band shapes with oppositely signed overall patterns. Furthermore these VCD bands are significantly shifted in frequency from each other so that the negative components arising in each are completely resolved. It is this shape reversal combined with shifts corresponding to the band width that leads to VCD evidencing more sensitivity to the structural variation than ECD (3,12). Thus globular proteins with a mix of alpha and beta components have VCD spectra resembling a simple linear combination of these forms. As a consequence, one can state that the qualitative aspects of the protein secondary structure are more simply represented in the protein VCD than in the protein ECD. The same qualitative advantage is evident in the amide I VCD for proteins in H2O, as is illustrated in Figure 2 where the VCD of chymotrypsin, myoglobin, andribonuclease A are compared.
- The same sort of advantage, only stronger, can be said to obtain for the protein VCD spectra in comparison to Ir absorbance spectra, since the IR only evidences minor shifts in the overall band shape with conformational change as compared tothe overall band shape variations seen in VCD. Of course, with FTIR it is possible to resolution enhance the IR absorbance and improve the discriminatory capability of that technique. However the IR analysis is typically dependent on frequency assignment of features which we have shown to be non-unique (13). Since VCD and FTIR sample the same transitions, it was possible to use VCD to demonstrate that bands occurring at specific FTIR frequencies can have opposite VCD signs in different proteins. For example transitions above 1670 cm-1 can occur withnegative signs in proteins of predominantly helical character and with positive signs in proteins of little helix and substantial beta-sheet and coil character. There is no way that these transitions that all occur in the same frequency interval and are often assigned to turns can arise from the same structural unit and have different VCD sign patterns. Since the only way that the same conformational unit in two peptides can give rise to opposite VCD signs is for them to have the opposite handedness, this work clearly demonstrates that FTIR frequencies have an ambiguous, at best, correlation to structure. The strength of VCD (or ECD for that matter) is its unique dependence on the local chirality of the chromophores being studied. In this case, for the amide I band, the chromophores are highly localized C=O stretches whose chirality arises almost entirely from coupling to their near neighbors.
- For proteins in H2O solution (4), the amide I VCD is sometimes more intense than is the corresponding amide I' VCD in D2O solution, but the patterns simply correlate back to the basic peptide studies, with the most difference between the amide I' and I VCD evident in mixed alpha and beta systems. The alpha helical dominated proteins, such as myoglobin, have two signed VCD features in H2O, with the lower negative band that is seen in D2O disappearing and the positive becoming stronger and broader as is clear in Figure 2. On the other hand, the beta-sheet dominant proteins,such as chymotrypsin, have a dominant negative band to lower frequency(~1635 cm-1) much as seen for the same samples in D2O.
- The H2O based measurements illustrated here (4) allow simultaneous study of the amide II VCD for the same sample in the same cell at the same concentration. For subsequent quantitative studies this has an advantage in stabilizing the spectral data set. The amide II evidences less shape variation and little shiftwith secondary structure change. The alpha-helicalamide II VCD is predominantly negative and falls to lower frequency than the absorbance maximum while the beta-sheet amide II VCD is a somewhat weaker negative couplet centered on the absorbance. Again the mixed structure proteins have a VCD that looks roughly like a linear combination of the two more extreme forms. These amide II patterns have a variance with secondary structure roughly comparable to that found with ECD.
-
|