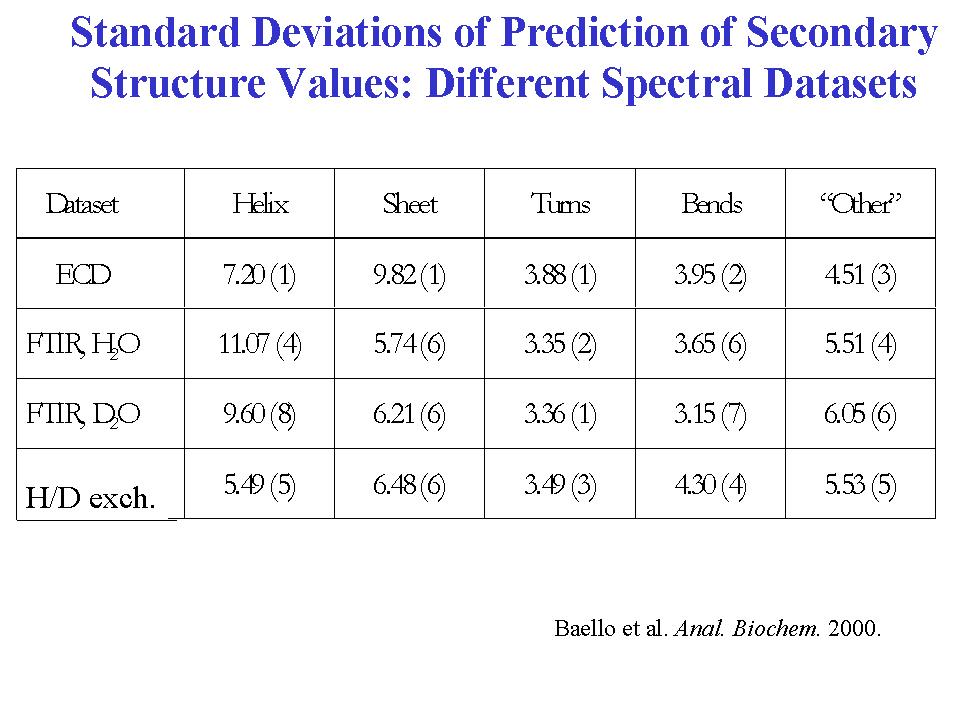
- A statistical analysis of the amide I' VCD data for 13 proteins to fit their fractional secondary structures as derived from x-ray crystal structures resulted in a method of secondary structure analysis that gives more precise fits, particularly for the beta-sheet, under defined conditions, than with the same statistical method using ECD data (Table I)(12). These analyses were done with a limited set of spectral parameters, keeping only those found to have a statistically reliable dependence o n secondary structure parameters. This is in contrast to many current methods which use multiple spectral parameter sand achieve apparently very precise fits. Expansion of the database to include more proteins and inclusion of the VCD of the amide II band for the same expanded set of proteins in H2O leads to a stable analysis and the capability of fitting more secondary structural elements (14). Our preliminary results indicate that using the VCD spectra measured for the amide I and II bands on the same sample in H2O, and thereby avoiding the complications of deuterium exchange, can lead to relatively more precise fits (15). But in both approaches, increasing the number of proteins beyond the original 13 (to 23)leads to some decrease in the precision of statistical fit when the analysis is done under the same conditions. Of course with more parameters used, the precision improves. In all cases, better fits are obtained with parameter sets that have contributions from both spectral transitions.
- However, the main goal of spectral analyses of secondary structure is not fitting but prediction of secondary structure for proteins whose x-ray structures are unknown. In our initial study we tested prediction by leaving one protein out of the analysis and optimizing the regression on just 12 protein spectra. Then the equations were used to predict the structure of the protein left out. This was repeated for each protein in the set and the average prediction error computed and compared to the error of the fit. As expected the predicted values were worse than the fit values, but in the initial attempt the difference was not too large (Table I). Unfortunately, we have found that the improvement of the fit as described above with more parameters and/or data from more than one transition is not matched by an improvement of the quantitative predictive capability of the method, tested as described above for one protein left out of the set, even with the larger set of proteins (14). [In an alternate a pproach, predictive capabilities of the method are also being tested on structures for various species and under different environmental conditions.
-
|