Integration
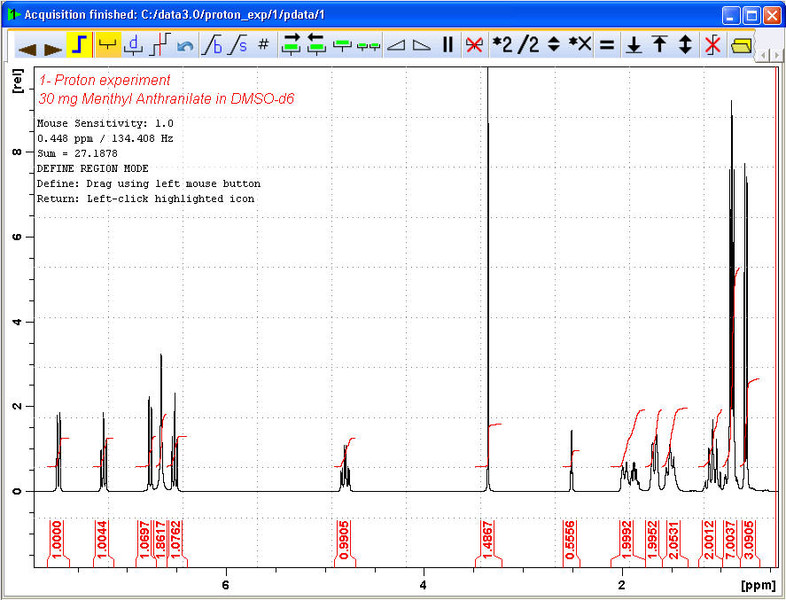
To quantitatively analyze an observed Proton signal, the integrated intensity of the peaks is compared within each other. It is common to integrate a Proton spectrum to account for the number of protons in the analyzed molecule.
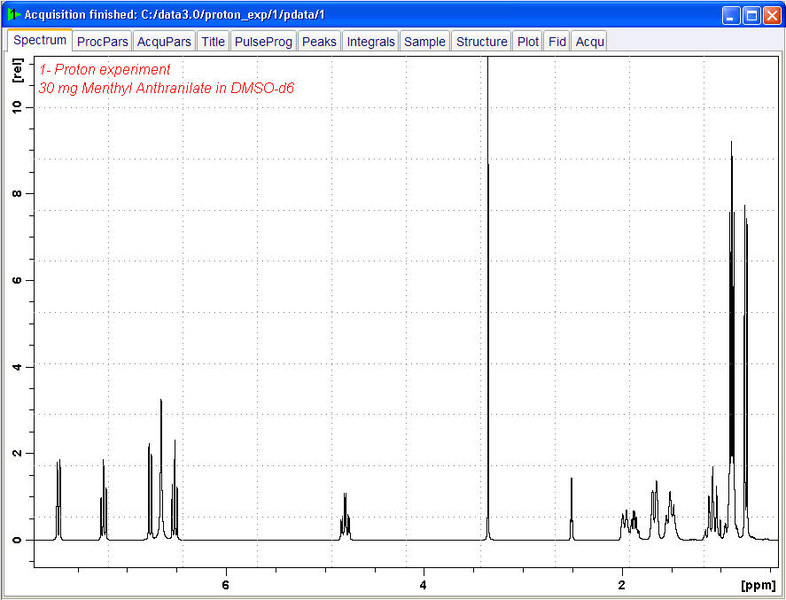
1. Expand the spectrum to include all peaks.
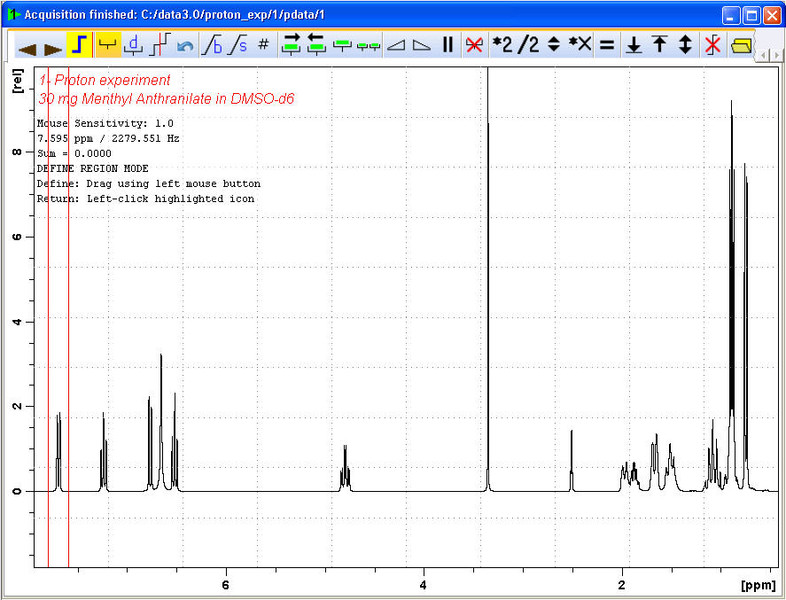
2. Click on the Integrate button in the Workflow button bar.
The Data Set tabs are replaced by the Integration Tool bar:
3. Set the cursor line, starting at the left of the spectrum, to the left of the first peak to be integrated, click the left mouse button and drag the cursor line to the right of the peak, then release the mouse button.
4. Repeat step 3 for the remainder of the peaks.
5. Click on the Return, save region icon in the Integration Tool bar.


