It is easy to convert the processed spectrum in Topspin to a XY (X=ppm and Y=intensity) text file. This way you can read it into
any graphing program of your choice. Just type "txt" like below from the command line in topspin when you're done processing.
The resulting text file is named "ascii-spec.txt".
It can be found in your data file eg)
/filename/1/pdata/1/ascii-spec.txt
here is an example output
Below I just plotted the result in the graphing program XMGR.
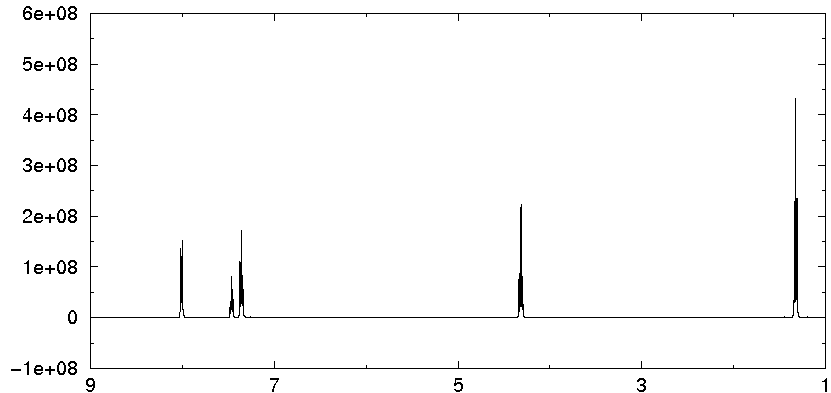
Please note that integrations can be done by simply adding the Intensity values in the ppm regions you define. Then these results are normalized relative to one another. eg) add results from 1ppm to 2ppm and 4ppm to 5ppm etc. The baseline contributes zeros to the sum so it is ok to include as well. This should be possible in excel or just write a script of some sort. Of course one can always just transfer the values observed from an NMR program as well.