Here is a little script to generate the dosy setup macros for you NMR managers. It is run within the /mac directory of xwinnmr or topspin and generates 2 files
'rundosy' and 'setdosy' which you run from the command line. mkdosy.pl
The original 'glove' fitting software was developed by Jonathon C. Lansing in the Wright/Dyson group at the Scripps Research Institute. The Code was never published however.
This fitting routine can actually be used to for any series of 1D bruker or varian formats. For example, T1/T2, kinetics, or any exponentially decaying model. Other functions can easily be incorporated with some modification of the source code.
Some comments regarding the processing routine. Bruker usually has a processing/analysis routine however I like the control of my own scripts.
All the processing and analysis is done in the linux environment (Fedora 14) on a dual boot machine. For UIC students I would recommend trying to learn and install Linux as there is a lot of freeware for data processing. A list of needed programs would include:
Here is a gzip'd and tar ball of an entire directory with all scripts and data. Use gunzip and tar xvf to extract.. DOSY.tar.gz
In general I'd run a series of processing steps using the scripts contained in above:
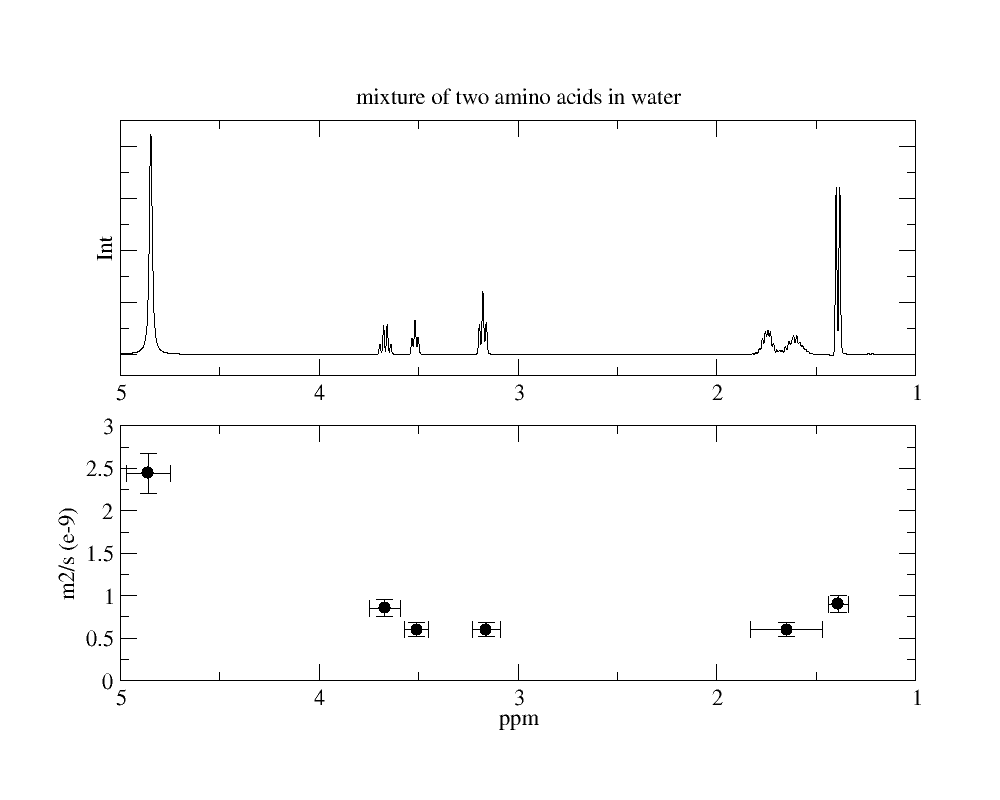
All the results will be viewed in XMGR. I've have a file 'xmgr.results' which serves as a template to give:
In order to read in existing data use 'soft kill' function in xmgr for both graphs and read in '1.dat' file for top and 'results.txt' for bottom. Note the top graph is in XY
format and the bottom is XYDY.
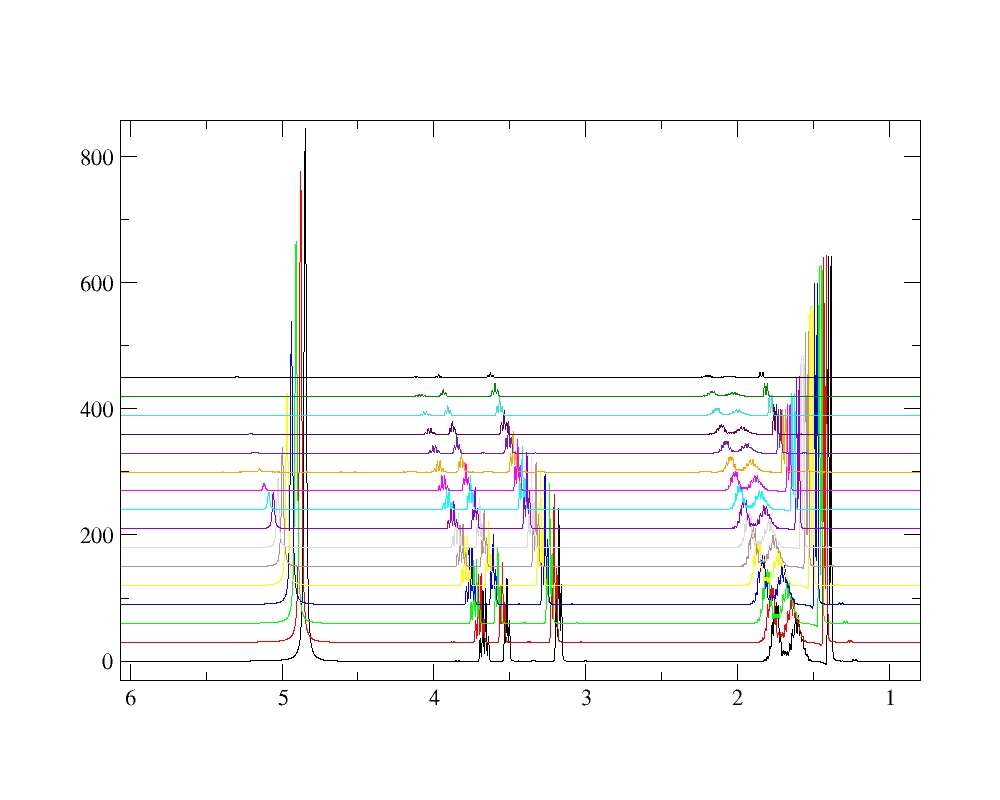
Run the script ./makexmgr.pl > stack.dat in order generate a series of 1D stack plots like below. You can edit the 'mkxmgr.pl' to change the X and Y offsetting as you like..
./mkIntegral man.xpk > Int will generate a file using an integration range instead of peaks. The integral range is defined in the file 'man.xpk' (open to see simple format)
I usually just manually edit this file while looking at and xmgr plot of say 1.dat.
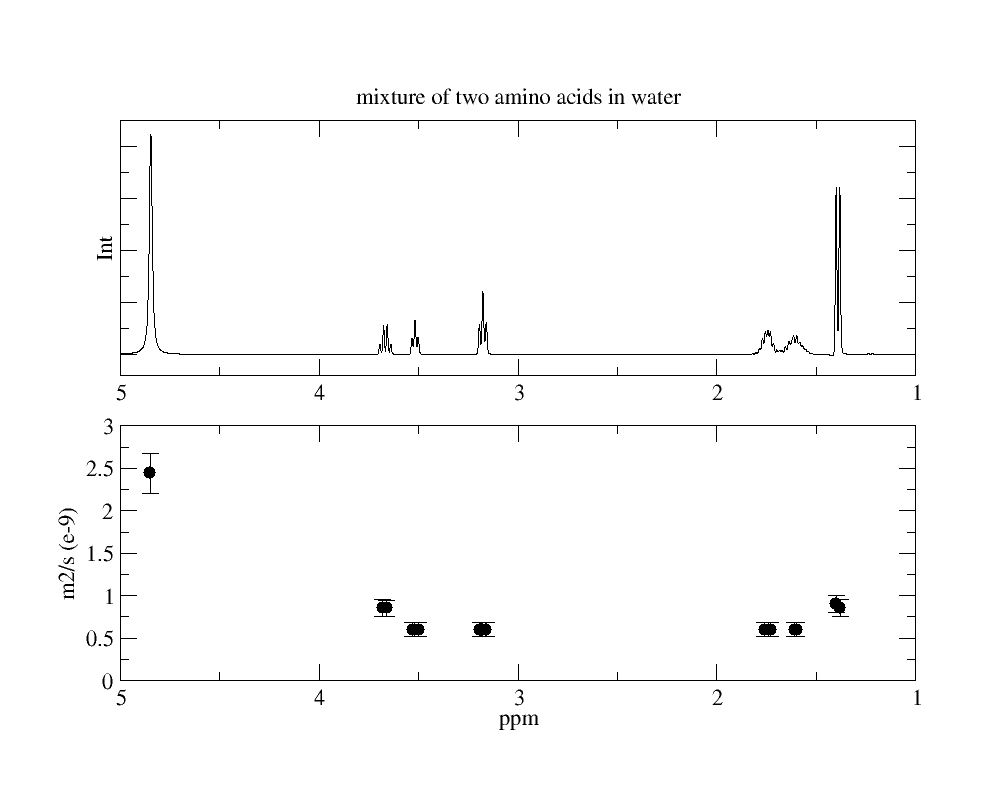
cd into glove_integral and run the go script. This will fit the Int file data as before. getdosy can then be used to extract a results.txt file to read into xmgr.
xmgr.results here is a template to read in data as before. Note top graph is XY format and bottom is now XYDXDY.
The results are now displayed as integral ranges represented with error bars in XDX and errors in YDY.